NewNarrate it yourself, from your phone

Your numbers,
told in a
60-second video.

Send us your data, or just the topic. If the numbers are public, we do the research for you. We script, chart, narrate and brand a 60-second story, then hand you every cut for LinkedIn, Shorts, Reels and your site.

Public data? We research itSources on screenEvery number checkedOriginal musicYour voice or AI voice
Your video, in your own voice · 0:43
Voice memo receivedCleaned & synced
16:91:19:1615 s
Sources on screenCited in every frame
Every number checkedBefore it's narrated
Original musicScored for your video
Your voice or AIAI voice at no extra cost
How it works3 steps · about a week

Your video, in your own voice.

Customers trust a voice they know. We write the words; you read them into your phone. Prefer not to record? A natural AI voice is included.

1
Send us your numbers, or just an ideaYour own spreadsheet or report. Public data, like your county's market, we research for you
You
2
Approve your scriptWe send it within 2 days. Edit it, then read it into your phone, or pick an AI voice
You
3
Get every cutCharts, captions and music timed to your voice, in 16:9, square, vertical and 15 s
Us

The explainer, vertical cut

Market recap, vertical cut

SamplesFinished deliverables

See what you'd get.

Fictional organizations are labeled on screen with illustrative numbers. Everything else uses public data, with the source shown.

NEW1:15
Nonprofit · Donor impact

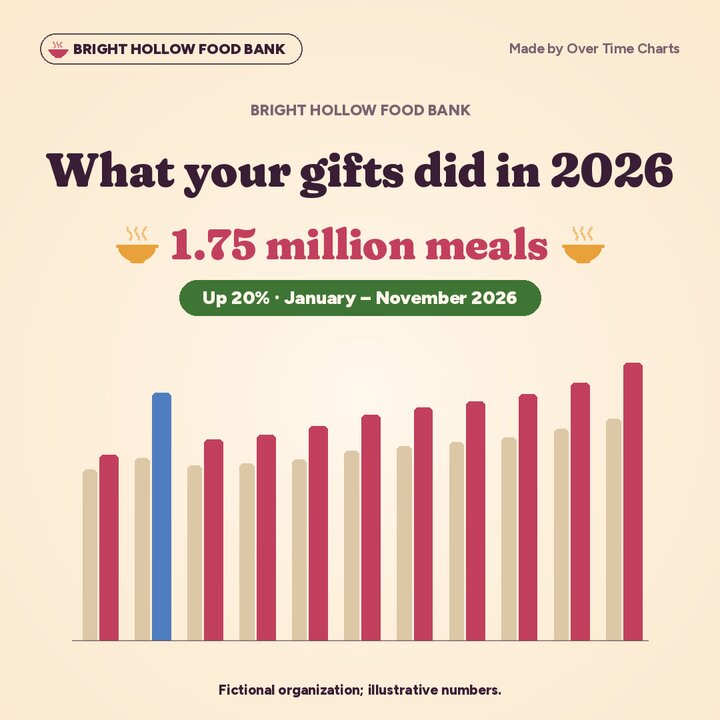
Bright Hollow Food Bank: our year in meals

Sample organization, illustrative numbers
1.75Mmeals
63pantry partners
NEW1:05
Real estate · Monthly recap

Ulster County Market Recap: September 2026

Data: Redfin
NEW1:05
Contractors · Year in review

Hearth & Hollis: our 2026 in numbers

Sample business, illustrative numbers
1:25
Mortgage lenders

Prices and rates, high at the same time

Data: Freddie Mac, Census
1:21
Building products

$520 billion and flat: America's remodeling market

Data: Harvard JCHS
1:12
Fintechs & banks

How Americans pay: credit passed cash

Data: Federal Reserve Bank of Atlanta
NEW1:15
Small business

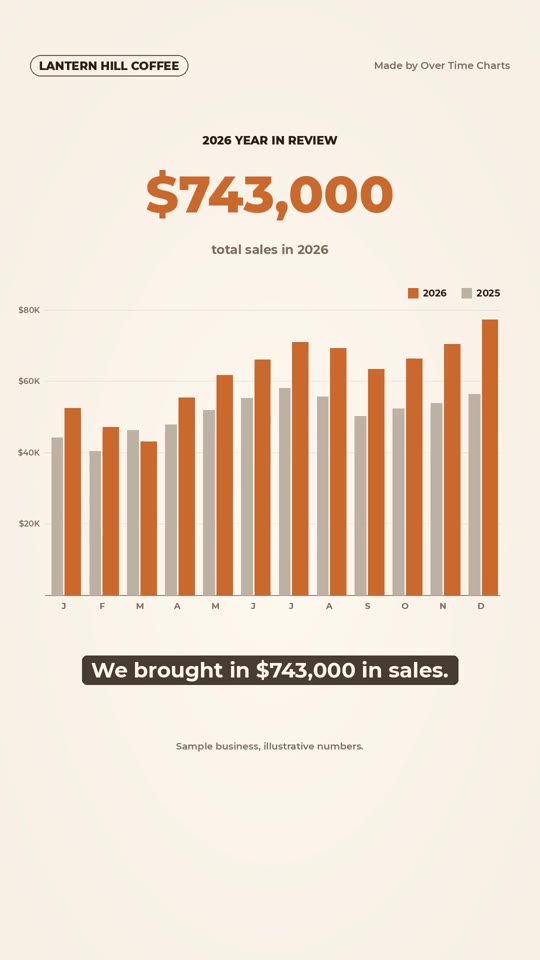
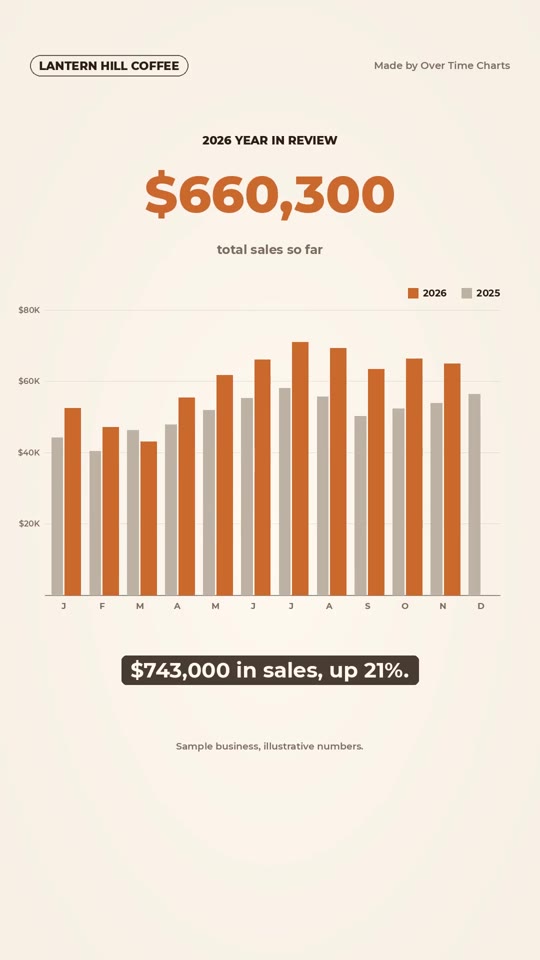
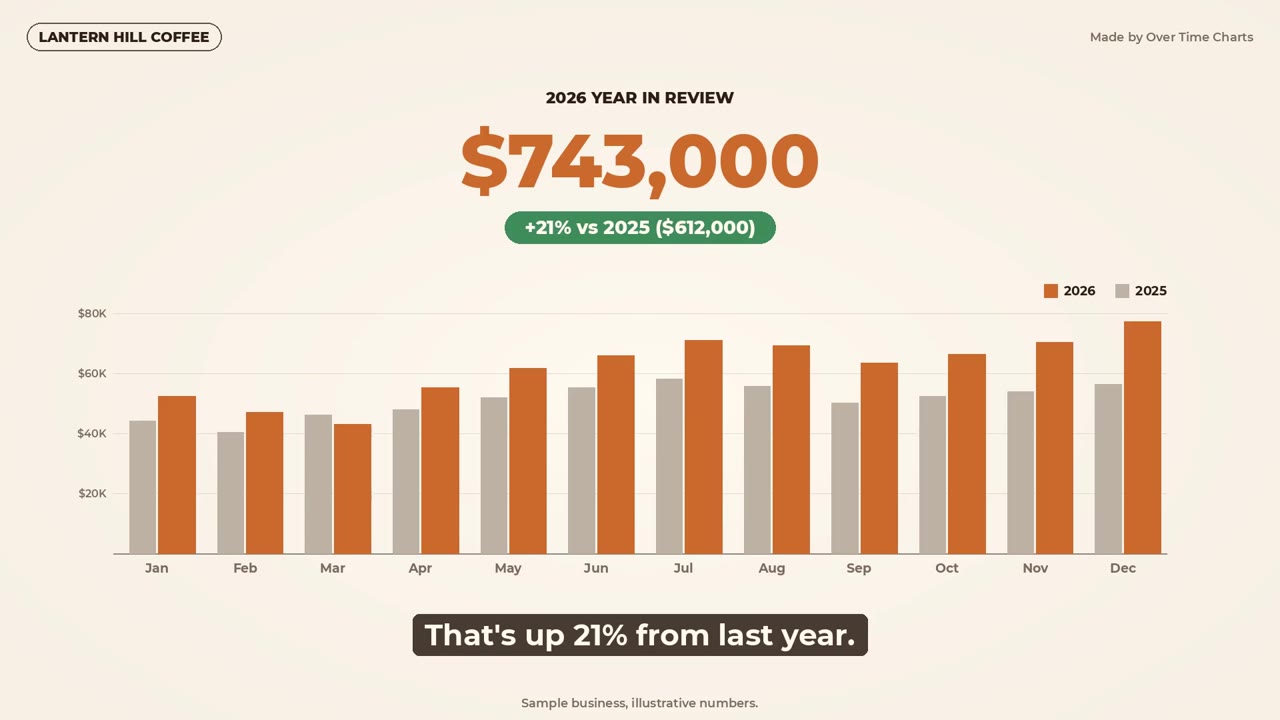
Lantern Hill Coffee: 2026 Year in Review

Sample business, illustrative numbers
1:26
SaaS & research

The 2026 State of Video, in 90 seconds

Unofficial sample based on Wistia's public report; not affiliated
Who it's forFive kinds of customers

Built for businesses with a story in their numbers.

🏡

Real estate agents & lenders

A monthly county recap with your photo and brokerage on the end card.

Monthly recap
🔨

Contractors & home brands

Costs now vs then, ending on "Get a free quote."

Starter video
📊

SaaS & research firms

A report as a hook, three findings and a download button.

Report to video
🐾

Nonprofits

An impact report donors will watch to the end.

Report to video
☕

Small businesses

A year-in-review for your regulars and followers.

Starter video
16:9 hero cut
16:9 hero · 60–90 s
1:1 square cut
1:1 square
9:16 vertical cut
9:16
15-second clip
15 s clip

One story. Every cut.

A 60–90 second hero video in your own voice or a natural AI voice, plus square, vertical and a 15-second stat clip.

  • Your logo, colors & CTAOn every frame and the end card
  • Captions burned inFor muted viewing
  • Sources on screenEvery number checked
  • Original musicNo stock loops
PricingSimple and upfront

Start with one video, or one every month.

Starter video

$750

One data story with all four cuts. Subscribe to the monthly recap within 14 days and we credit the full $750 to it.

Best for a launch, a report or a year in review

Buy now: $750Questions first? Get a quote
Agents & lenders

Monthly market recap

$149/mo

A fresh local recap every month, plus three short chart clips to post in the weeks after.

Best for agents and lenders who post every month

Subscribe: $149/moQuestions first? Get a quote

Report to video

from $1,500

Your report as one 60 to 90 second main video plus three 30 second chart spotlights.

Best for research firms, SaaS and nonprofits

Get a quote
CompareStarterMonthly recapReport to video
Price$750, credited if you subscribe within 14 days$149/month, cancel anytimefrom $1,500
What you getOne data storyA monthly recap plus 3 weekly chart clips1 main video plus 3 chart spotlights
Cuts16:9, square, vertical & 15 sVertical & 15 s16:9, square, vertical & 15 s
Your branding✓✓✓
RevisionsOne roundOne roundTwo rounds
TurnaroundAbout a weekDelivered by the 10thAbout 2 weeks

Custom projects and agency white-label: ask us.

FAQQuick answers

Questions, answered.

Still wondering? Email hello@overtimecharts.com.

Do I have to record the narration myself?

No, it's optional. If you'd rather not, we use a natural AI voice at no extra cost.

What do you need from me to start?

Your numbers, a report, or just an idea. For a market recap, just tell us your county.

Do I need to have the data?

No. If it's public, like home prices, mortgage rates, census or industry numbers, we find it, check it and cite the source on screen. Private numbers, like your sales or donations, come from you.

How long does it take?

We send your script within 2 days. A Starter video takes about a week from start to finished cuts.

How do you make sure the numbers are right?

Every number is checked before it's narrated, and its source is shown on screen.

Where can I post the videos?

Anywhere: the 16:9 hero for your website and YouTube, the square cut for LinkedIn, and the vertical cuts for Shorts, Reels and TikTok.

Do you offer white-label for agencies?

Ask us. Agency white-label and custom projects are quoted per project.

Tell us what your customers should know.

Send your numbers, or just the idea and we'll research the public data. We'll reply within 1 business day with a script approach and a quote.

Prefer email? hello@overtimecharts.com
Free, no obligation

Get a quote

Tell us what you want to show. We'll reply with a script approach and a price.

Your numbers, a market, or just an idea. We research public data for you

We reply within 1 business day. No sales calls, no mailing list.

Prefer email? hello@overtimecharts.com